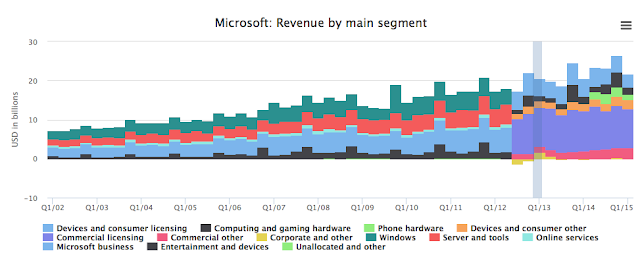
The above chart compares Microsoft's revenues from its 13 segments against its product sales from Lumia phones , Non Lumia phones and Xbox consoles .The 1st chart clearly shows how " windows "sales were its main source of revenue till 2012, after which devices and consumer licensing along with gaming and entertainment contributed significantly to its revenues. The second chart compares Microsoft's product sales from Lumia and non Lumia phones including Xbox


ليست هناك تعليقات:
إرسال تعليق