السبت، 31 مايو 2014

How Consumers Consumer Online Content : PC vs Mobile

PC Consumer usage vs Mobile
Consumer  Content  Consumption  : Mobile vs PC


" B2B content emerged as the most heavily consumed on PCs, likely a reflection of B2B buyers and decision-makers being far more likely to be using PCs at work than the typical adult." While Mobile users must be using it mostly at Home and a few probably at office

This was  a study which "  showed how users consumes content, across cross  devices ( in this study Mobile and PC ).  While 80% of time spent with B2B content was via PCs, whereas 79% of time spent with streaming radio was on smartphones, per the study.


 But beyond B2B, other content categories are also heavily consumed on PCs rather than mobile. Those include automotive (where PCs represent 76% of minutes), travel (68%), TV (67%) and business/finance (62%). 


Mobile devices accounted for at least half of time spent in 6 of the 14 categories. Streaming radio was the most heavily mobile, with 95% of online time spent with the category coming via smartphone (79%) or tablet (16%). Mobile devices also comprised a majority of time spent with games (85%), social media (72%), weather (69%), and retail (53%), and half of the time spent with health content.

Foursquare CEO , Leaves amidst strategic restructing


Foursquare senior management has been moving out recently   as the company tries to  redefine the Geo Location Market .These departures happening just when its senior exec were supposed to  : split uplit up its flagship application, the company itself is making significant changes. Chief operating officer Evan Cohen and business development head Holger Luedorf are leaving the company after four years, Recode reports"

Foursquare recently decided to split its famed check-in service into a separate app it calls Swarm, which not only checks users into particular locations, but broadcasts their "ambient location" to help friends meet up whenever they happen to find themselves in the same general location.

الخميس، 29 مايو 2014

How Internet and mobile web is driving the digital economy in APAC region


The  above data from wearesocial shows  how Internet and Mobile is aiding the digital economy of these nations  and how technology plays a crucial role in revving up an economy 

The research the study  takes into account  each nations digital indicators , and ranks each of them is assigned a score . Some of these parameters  were  internet penetration, number of internet users, mobile usage and penetration, 3G, 4G networks,  penetration of mobile web, broadband, usage , social media numbers and  smartphone usage among several other parameters


The research  compared all the  above digital indicator metrics across all 30 APAC nations  Combining all of the APAC nations, that is , if  APAC were a country this is how its numbers would have  stacked up 

  • Internet Penetration : 37%
  • Social Media Penetration : 26%
  • Mobile Connectivity/Penetration : 93%

The Mobile Landscape in Norway :

Source: StatCounter Global Stats - OS Market Share

Source: StatCounter Global Stats - OS Market Share

According to the latest Transparency Market Research published new "Mobile Content Market - Global And U.S. Industry Analysis, Size, Share, Trends And Forecasts 2011 - 2017" market research report show the overall value of the mobile content market as well as the value of the mobile games market in 2011

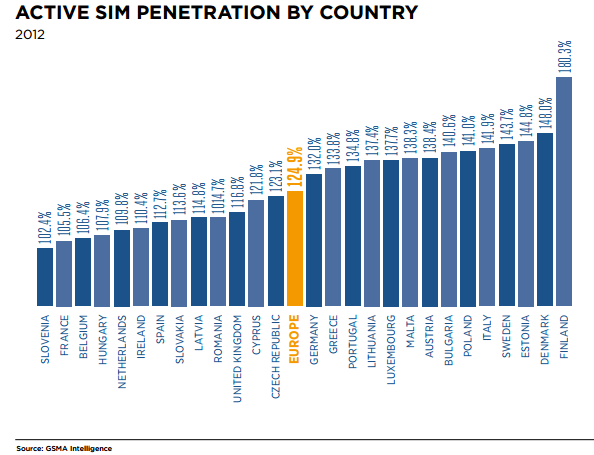
Finland, Denmark and Estonia among the top 3 Highest Mobile SIM Users

Mobile SIM penetration in Europe  stands at an average at 125%, (multiple SIM holders according to a GSM  report.However in terms of mobile SIM users in  European nations ,  there are still significant variations in penetration rates across Europe, although some of the historical differences in penetration across the region have narrowed sharply over recent years. 

Estonia is now one of the highest SIM penetrated market in Europe, whilst the likes of France and Spain are amongst the lowest penetrated. The total number of SIM connections has grown in nearly every market in Europe over recent years, although Spain is the one market to see a clear decline in the number of active SIM cards

Comapring mobile usage by SIM activities


Your supreme guide to cloud certifications


By 

A few years ago cloud computing was a popular buzzword, rather than a significant piece of the IT puzzle. However, times have changed and the cloud has become one of fastest growing, most versatile technologies.

Although its presence is growing rapidly, cloud computing is still in the relatively early stage of its adoption. There are still thousands of companies, who are only now considering moving to the cloud.


Image courtesy of digitalart/FreeDigitalPhotos.net

What’s the current state of play?

According to a survey by WANTED Analytics, over 2,400 organisations were seeking IT professionals with cloud computing skills in 2012. 

An IDC White Paper, commissioned by Microsoft, also revealed that “cloud-related skills represent virtually all the growth opportunities in IT employment worldwide and demand for cloud-related positions will grow by 26 per cent annually through 2015”

In EMEA, IDC forecasts that cloud-related IT jobs will grow by 24 percent per year to about 1.4 million by 2015.

What does this mean? This means that now is your time to get your head in the cloud, certify your skills and get a thick slice of technology’s tastiest cake. Here are nine cloud computing certifications that will help you make the most of technology's fastest growing field.

1. CompTIA Cloud Essentials

The CompTIA Cloud Essentials certification is your ideal entry level certification, as it covers the basic fundamentals of cloud computing such as:
  • Cloud types
  • Adoption and implementation of the cloud
  • The impact of cloud computing on IT service management
  • Cloud computing risks
With this cert under your belt, you demonstrate that you have an understanding of cloud computing from a business, as well as from a technical perspective. As part of this certification, you also learn how to migrate to the cloud and about the governance of cloud computing environments.


2. CompTIA Cloud+

Cloud+ is a newly developed certification by CompTIA, which puts great emphasis on IT security. It’s perfect if you already have some experience in working with cloud technology.

As a Cloud+ certified professional, you will have an understanding of cloud computing terms and methods, and the aspects of IT security. You’ll also be able to maintain and implement cloud infrastructures, including network and virtualisation technologies.
The Cloud+ certification also covers:
  • Resource management
  • Security
  • Systems management
  • Business continuity in the cloud
3. Rackspace: CloudU

CloudU by Rackspace is a vendor-neutral certification programme designed and developed for IT professionals and decision makers. CloudU teaches you the fundamentals of cloud computing, with the help of whitepapers, lectures, quizzes, video tutorials, e-books, webinars and live events.

CloudU’s content is available to anyone, however in order to obtain the certification, you must complete 10 CloudU lesson quizzes and a 50 question final exam.
The lessons of CloudU cover everything from cloud types, virtualisation and security to application programming interfaces (APIs) and hypervisors.


4. MCSE: Private Cloud

This certification is the crown jewel of Microsoft’s cloud portfolio. The MCSE: Private Cloud certification proves your skills in managing and implementing Microsoft private cloud computing technologies. Combined with Windows Server and System Center, you’ll be able to build your Microsoft private cloud to provide flexibility for your IT infrastructure.
As part of this certification you’ll cover topics such as:
  • Deploying cloud services
  • Monitoring private cloud services
  • Problem management in the cloud
  • Private cloud protection and recovery
Prior to getting this certification, you need to already have your MCSA: Windows Server 2012, which includes passing Exams 410-411-412.

5. VMware Certified Associate – Cloud (VCA-Cloud)

VMware’s full portfolio of cloud computing certifications is currently made up of six different cloud-specific certs, from beginner to advanced levels. The first level of this hierarchy is VCA-Cloud, which can be obtained by completing a free, self-paced eLearning course.

To prepare for your VCA-Cloud exam you may take the VMware Cloud Fundamentals course, which will teach you to define and describe the different types of clouds and also provide an overview of VMware vCloud Suite.


6. HP ATA – Cloud

HP’s Accredited Technical Associate – Cloud certificationteaches you industry-standard virtualisation technologies, including the planning and designing of common virtualised services and their implications for customer needs.

As part of this certification, you learn how to design, implement, and support end-to-end IT systems. Furthermore, you also learn about the following:
  • Installing, configuring, and upgrading servers, storage, data networks and applications in business environments
  • Differences between hosted, co-located and cloud networks, and a traditional on-premises network
  • Business implications and selection criteria of appropriate responses to a given business scenario
7. CloudSchool.com – Certified Cloud Professional (CCP)

Certified Cloud Professional (CCP) by CloudSchool.com is a vendor-neutral cloud certification, focusing on fundamental topics of cloud computing. With this certification under your belt, you’ll be familiar with cloud computing terminology and concepts, as well as the benefits, challenges and risks of using the cloud. 

You’ll also learn about SaaS, Paas and Iaas models and the different types of clouds. To get your CCP certification, you must pass two exams:
  • C90-01 Fundamental Cloud Computing – standard prerequisite of CloudSchool.com certs
  • One additional exam from this list
CloudSchool.com offers self-study resources, study sessions as well as instructor-led workshops to help your prepare for the exams. 

8. Cloud Security Alliance: The Certificate of Cloud Security Knowledge (CCSK)

The Certificate of Cloud Security Knowledge (CCSK) certificationis another vendor-neutral qualification, which proves your expertise in key areas of cloud security such as:
  • Architecture
  • Compliance
  • Governance
  • Virtualisation
  • Operations
  • Encryption
According to Gavin Hill, Venafi’s Director of Product Marketing: "With data being the new currency, the control of trust in the cloud is ever more significant. The CSA updated Certificate of Cloud Security Knowledge (CCSK) brings practical guidance to security professionals deploying workloads in the cloud. It delivers the necessary controls that enable security professionals to deploy cloud applications with security and trust mind."

9. (+1) IBM Certified Cloud Solution Architect v1 and v3

Last but not least, let’s take a look at both versions of IBM’s Certified Cloud Solution Architect. v1 and v3 certify your skills to design, plan and manage IBM's cloud computing infrastructure. As an IBM Certified Cloud Solution Architect you are also able to provide a detailed overview of the benefits and underlying concepts of cloud computing.

To obtain these certs, you should have a working knowledge of cloud fundamentals as well as a basic knowledge of IBM cloud computing essentials.

There you have it nine (+1) cloud computing certs that will definitely get you ahead of the curve and help you make the most of what the cloud has to offer. And if you are interested in even more cloud certs, check out our full cloud portfolio.

About the Author:       
Sarah writes for Firebrand Training on a number of IT related topics. This includes exams, training, certification trends, project management, certification, careers advice and the industry itself. Sarah has 11 years of experience in the IT industry. 

4G ,LTE based Mobile Broadband Users to exceed a billion, cover 85% global mark

A
1billion users to have 4g  by 2017


ITU ( international Telecom Union ) estimates show that
 there are 2.1 billion active mobile-broadband subscriptions in the world  till 2013 , this is people with a 3G or 4G connection). 

Users with mobile broadband  consists of  29%of the global population, and mobile broadband subscriptions  have grown 40% YoY over the last 3 years years Mobile  broadband today outnumber fixed broadband subscriptions by a ratio 3:1

Meanwhile  there were   176 million LTE ( Long term Evolution or 4G number) users by 2013 ,compared to 90 million in 2012. However  by 2017  the number of LTE  users across the world is expected to number about a billion..and would account for  about 1 out 8 mobile connections .A recent Ericson report " projects  that 85% of the world’s population will be covered by high-speed mobile networks by 2017.In the United States, LTE networks cover  90% of population, compared to 47% in Europe and 10% in Asia

Global Mobile Connections Nearing 10billion


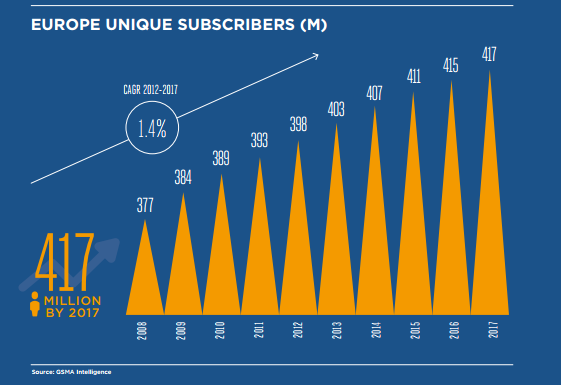
Unique Mobile Subscriber in Europe total 417 million,with700 active connections

According to the Four out of five individuals have subscribed to mobile services in Europe, while many countries have reached the unique subscriber penetration ceiling (90%) above which mobile growth tends to stall

europe has 700million mobile  connections, with 79% user base


The total unique subscriber base in Europe is expected to reach 417 million by 2017, with close to 700 million active connections by the same date according to gsma. The rate of growth going forward is likely to be somewhat slower than in recent years, as the high absolute penetration rates means that the market is becoming increasingly saturated.

Globally 45% of the global users had subscribed to mobile services in 2012 ,compared to Europe which had 79% mobile subscribers


Mobile Broadband in Europe set to rise to 573million ,set to grow 15% CAGR upto 2017

European Mobile broadband  set to see 100% increase

Mobile Broadband in Europe which  was lagging  as compared to other developed nations is set to  zoom to grow at15% CAGR.. By 2017  Europe will have  573million users connected via mobile broadband . Correspondingly Mobile data volume is set to rise 54%
According to the data by GSM Economy

الأربعاء، 28 مايو 2014

Digital marketing Stories for the Month in Charts

More soaps and beauty products sold online that insurance

consumer goods  to increase their online budgets by 20%

Consumer Goods Historical Spending  data


Consumer  Goods brands have traditionally been big spenders on TV and Print.. However that start changing from  2011 onwards, when CPG brands started moving online.. and very soon  Procter Gamble, Unilever, Colgate, General Mills  started to see amazing results as they started reaching consumers at a fraction of the cost what  they did earlier.. With Mobile web  Procter and Ganble could have access to consumers via video.. which could be played " with amazing clarity and faster"

Using impressions rather than clicks to measure digital campaigns was far more predictive of real-world results and increased the estimated ROI of Facebook advertising by as much as 75%, according to Ross Link, Nielsen's president of global marketing return on investment solutions. 

L'Oreal, the world's third-biggest ad spender behind P&G and Unilever,  is set to increase their digital budgets upwards from  12% . Last year 20% Loreal sales came from onlineGeneral Mills has almost doubled their digital marketing budgets from 8% in 2008 to 17% in 2008 Currently 79% of their ad dollars are spent on TV. 


5 Markets With Highest Revenue From Paid Content on Internet

Dating and Gaming among highest revenue churner on the web

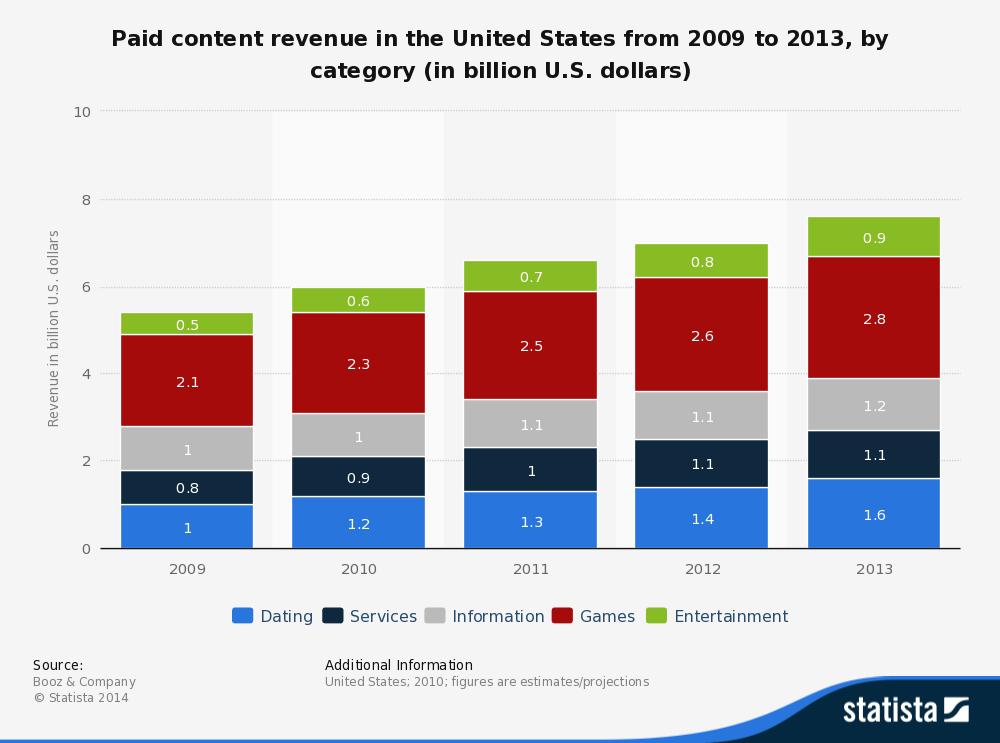
The above chart published by statistica from a research report undertaken by Booz & Company estimates of the paid content revenue in the United States from 2009 to 2013, broken down by content category. 
According to Booz & Company, games will generate 2.8 billion U.S. dollars revenue in 2013. Global And U.S. Industry Analysis, Size, Share, Trends And Forecasts 2011 - 2017" market research report show the overall value of the mobile content market as well as the value of the mobile games market in 2011

Mobile Content Market set to zoom 19% CAGR,led by Mobile Gaming


source :statistica/ Transparency Research

According to the latest Transparency Market Research published new "Mobile Content Market - Global And U.S. Industry Analysis, Size, Share, Trends And Forecasts 2011 - 2017" market research report show the overall value of the mobile content market as well as the value of the mobile games market in 2011.

The Mobile global content market is currently worth 6.5 billion U.S. dollars which  is expected to reach USD 18.6 billion in 2017, growing at a CAGR of 19.0% from 2011 to 2017. Mobile games are expected to be the largest market segment at USD 11.4 billion in 2017.In the overall global market, the U.S. mobile content market was the largest regional market with a revenue share of 30.3% in 2011. Moreover, faster adoption of mobile content in the region will significantly increase the market share of the U.S. to 41.0% in 2017.

Newspaper Reading in US Per Capita : 2008 Onwards

Statistic: Daily time spent reading newspapers per capita in the United States in 2008, 2013 and 2018 (in minutes) | Statista
source : Statista/Suhler Stevenson; Borrell Associates

 The statistic above presents data on the daily time spent reading newspapers per capita in the United States in 2008. It also offers an estimate for 2013 and a forecast for 2018. An average U.S. consumer spent 31.4 minutes daily reading newspapers in 2008..

The Biggest Geographical Area with highest ebook Consumption


The global e-book revenue from 2009 to 2016, broken down by region. In 2010, e-book revenue in North America amounted to 1.2 billion U.S. dollars.


Source PwC Survey by PricewaterhouseCoopers (PwC) .

eBook Trends and revenue : UK vs US

Statistic: Global e-book revenue from 2009 to 2016*, by region (in million U.S. dollars) | Statista


data via Statista

In August 2012, British Newspapers reported that for every 100 books bought in Great Britain from book stores there were 114 kindle ebooks purchased from online retailer Amazon . So will the paperback hardbound books meet the same fate as “ UK and US Newspapers 5 years ago ? does it seem to be the end of “ a generation of users feed on a diet of “ paperback pulp fictions that entertained book readers for the last 3 decades ”?.. There no definite answers as yet as “ book sales figures in UK is hard to come buy ..but whatever we can make from existing data .. here are some facts Using trends

In UK  from about 250 publishers, the association hs pegged the value of “ virtual books”bought by consumers in UK at pounds 92million in 2011.Meanwhile in the US While Book sales Sales at Physical stores made up 65% of their revenue, and digital formats made up 29%. Bookstats survey data suggests that in US “ physical stores still makes up the biggest part of the pie

Procter and Gamble to invests 30% of media spend in digital

Consumer Goods giant Procter and Gamble is   moving more of  its ad dollars into the digital medium, thereby investing almost a third of its media spend in digital, social and mobile as it looks for ways to improve marketing efficiency 


Search and Display to see high spending by Consumer Good  brands

 Executives of Procter & Gamble Co. and Mondelez International both said their companies now spend about a quarter of their U.S. media budgets on digital and plan to keep growing that share as they see improving return on investment. 


 P&G's global brand  head  ,Marc Pritchard  had recently explained about how it has shifted its mindset to “digital back” - campaigns that start in the digital world and build back into the rest of the marketing mix. P&G has previously said that is spends around 35 per cent of its US media budget on digital but has not released a figure for the business overall..


The focus on marketing efficiency comes as P&G, which owns Olay, Pantene and Duracell, saw  declining last quarter with .PG revenues were up by mere 5%YoY   to $22.28bn, down from 2 per cent growth in the previous two quarters. Profits were down almost 16 per cent to $3.43bn. 

الثلاثاء، 27 مايو 2014

Mobile Ad Spending Ranked by Industry :The Brands spending highest on Mobile

The US auto industry is in the midst of  massive advertising  spends across media The digital media particularly has seen  tremendous run-up in  search , display and mobile ad spending, piggybacking on cross-industry shifts in marketing budgets and historically strong domestic sales volumes

 Automakers and dealers will spend $6.15 billion on US digital advertising in 2014, up 18.8% from the previous year. All told, substantial annual digital ad spending increases by the US automotive industry will continue for the foreseeable future, according to a new eMarketer report

Digital acounts for 25% Global Advertising Spends,set to exceed 1$137.53

Digital Ad Spending accounts for 25% Global Spends on Media,  Internet Advertising  Worldwide to Hit $137.53 Billion in 2014  according to eMarketer: 

Digital and Online spending  including search and display  across cross platform devices  including desktop and laptop computers, mobile phones and tablets will reach $137.53 billion this year, according to eMarketer’s latest estimates of worldwide paid media spending."


Internet ad spends

 Digital Spending across the Globe 

Digital spend will be up 14.8% over 2013 levels, and will make up 25% of worldwide paid media That’s up from about one-fifth of spending in 2012, and it is set to rise to nearly one-third of the total by the end of our forecast period, when advertisers around the world will invest $204.01 billion in digital. - 

Nearly two in five digital ad dollars, which is 40% Internet advertising revenue  this year will come from advertisers in North America, compared with 28.6% in Asia-Pacific—where share is actually dropping slightly. Western Europe accounts for nearly one-quarter of all digital spending around the world, and other regions make up just a small share


الاثنين، 26 مايو 2014

The Google Story Retold : 15 Years Ago

Infographic: 15 Years of Google - How the Search Giant Dominates the Web | Statista
You will find more statistics at Statista

17% of Mobile Handsets in India Controlled by Samsung and Nokia


Smartphone Market Size India

Samsung and Nokia Control 17% of Indian Mobile Handsets

42 Million Chinese Consumers purchased Mobile on the web

Mobile sales reach 66billion Yuan in China from online

Latest research data published by ChinaInternetWatch showed that China mobile phones online sales volume reached 42.8 million and online sales hit 66.39 billion yuan (USD 10.74 billion) in 2013, with over 40% YoY increase. Mobile sale peaked during Double 11 promotion, sold out 4.48 million on November 11, 2013( . Tmall created Double 11, which is on Nov 11, nicknamed after Bachelor’s Day by Chinese. Taobao normally can expect sales of over billion yuan on one single day. Last year, the total sales exceed 3 billion yuan (USD 490 million


Indian Smartphone Shipments see a 220% Growth , in Q1, to 59million units


Statistic: Number of mobile phone users in India from 2011 to 2017 (in millions) | Statista


India’s smartphone shipments rose over 219% to 14.5 million units in January-March2014 , with more than half of the handsets shipped being 3G enabled, research firm CyberMedia Research (CMR) said on Tuesday. The country recorded smartphone shipments of 6.6 million units in the year-ago period, CMR said in a statement

Overall, 58.9 million mobile handsets were shipped during Q1 2014, a year-on-year growth of 8.9%,

Amazon's Online Sales is higher than their Combined nearest 9 Competitors

Infographic: Amazon's Online Sales Dwarf the Competition | Statista


"According to data from e-commerce research firm Internet Retailer, Amazon remains miles ahead of the U.S. competition in the online retail space.


 In 2013, Amazon's online retail sales amounted to $67.9 billion, more than the next 9 largest e-retailers combined.

Surprisingly, the second largest player in the e-commerce game is not a large retailer such as Wal-Mart or Staples, but Apple.


The iPhone-maker reportedly sold goods and services worth $18.3 billion through its website, the App Store and the iTunes Store in the past year.

Amazon's increasingly dominant position in the e-commerce market is owed largely to the company's aggressive growth strategy. Under CEO Jeff Bezos, Amazon has become known to reinvest most of its earnings, which is why the company has yet to turn a meaningful profit.
"


الأحد، 25 مايو 2014

How much do "Chinese Mobile Users" worth to Mobile Service Providers


 Chinese Smartphone market
Chinese 3G Subscribers 

In the run-up to iPhone 5S/5C launch event, the “cheap” iPhone 5C and its price was a #1 topic of speculation. A close #2 was Apple’s deal with China Mobile. Why were pundits so obsessed about getting iPhone on one Chinese carrier? 

In its latest article, Unwired.com " speaks about the " often over estimated Mobile Market in China .Yes, China Mobile is humongous - it has 740 million subscribers. But most of those subscribers use cheap 2G feature phones and wouldn’t care much about an iPhone. China Mobile’s 3G subscriber base is way smaller – around 180 million. Still a huge number, but majority of those subscribers use cheap $100-200 Androids, and aren’t available to Apple either.

And if you look at the combined base of around 150 million 3G subscribers at current Apple partners – China Telecom and China Unicom, you may wonder what the China Mobile fuss was all about.

Mobile Commerce Infrastructure Comparison : Hong Kong vs China


Hong Kong  vs China Mobile Shopping Index


Mobile Payments Comparison :Hong Kong vs China

While Hong Kong ranks a wee big higher than China... the difference among the nationaare actually miniscule. 

According to the data from Master card mobile readiness index  latestWhile HK has very strong financial and regulatory organizations Consumers are less willing to use mobile payments compared to their global counterparts on both P2P (10% versus 19% average) and m-commerce (11% versus 17% average).

Comparatively Chinese consumers are presently above-average users of mobile payments.The mobile infrastructure currently surpasses the financial services infrastructure POS payments (10%) lag behind m-commerce (19%) in frequency of use.

Online payment in India to cross $20B by 2015


Online payment industry to cross $20B by 2015 end led by IRCTC, Online Banking, Travel,Insurance and Financial Services   is said  to be forecast grow  40-45% in 2014-2016

"The digital payments industry is expected to grow at 40 per cent to reach Rs 120,120 crore ($20 billion) by the end of this year, according to a report by Internet and Mobile Association of India (IAMAI). Among the many use cases, online travel booking, financial services and e-tailing are the main purposes for using different modes of digital payments.

“Online travel industry, which includes air & train ticket bookings
hotel accommodations and tour packages contribute nearly 60 per cent of the digital payments. This is followed by financial services that comprises of online mobile recharge & DTH service, online tax filing, payment of insurance premiums, gas & electricity bills and e-tailing,” the report stated."

The 4 metros which include Delhi, Mumbai, Kolkata and Chennai are approximately 60 per cent of the total digital payment gateway market size. Next four metros – Bangalore, Hyderabad, Ahmadabad, Pune together contributes only 25 per cent to the total market size.


Tags :   India startup news, internet, mobile, e-commerce, software, online businesses, technology news, funding: 

The The Rise of the Big Big Data :What the Numbers Foretell

The Rise of the Big data

The Rise Of Big Data


The above inage shows Moonshadow Moonshadow Mobile’s data mapping and visualization in Real time .  These solutions are web-based, live “in the cloud” and have no specialized hardware requirements. 

The Rise of the Big data


  1. 12 Tearrabyte is a the size of total tweets a day
  2. Less that 0.50.5% data along the  digital highway is processed  , and only 36% of the big data can be be processed by “ existing technology”
  3. 90% digital data  beamed now  was generated in the last  past 2 years
  4. 32% growth in the Global  Bigdata Technology services market by 2016
  5. 36  Zettabytes was the quantum of  data the entire global IT technology will churn out  by 2020, according to McKinsey global projects.. In 2014 alone .. around 5 zettabytes will be added
  6. $100billion is the size of  the big data market globally by 2020. In 2025  IDC forecasts that big  data will be  a $25billion industry
  7. 92% of the  companies that was recently interviewed by Forbes agreed that lack  or presence of sufficient data  ultimately affect their ": work performance and  the presence of data almost always led to meet  their  goals

With 1.26 billion Mobile Users combined India and China account for 30% global users


Buoyed by expanding markets in India and China, global mobile subscriptions galloped to total around 6.3billion last year, with subscriptions growing at about 9% YoY growth according to a report by  Ericsson

According to theEricsson Mobility Report, total mobile subscription in China stood at 1.26 billion, while in India it was 713 million in 2012. The net additions in the Q4 of 2012 was 140 million.China accounted forabout 22 per cent of net additions, adding around 30 million subscriptions,followed by India (11 million), Bangladesh (9 million), Indonesia (8 million),and Nigeria (5 million), "Global mobile penetration reached 89 per cent in Q4 2012 and mobile subscriptions now total around 6.3 billion. 

However, the actual number of subscribers is around 4.4 billion, since many people have several subscriptions. China accounted forabout 22 per cent of net additions, adding around 30 million subscriptions, followed by India (11 million), Bangladesh (9 million), Indonesia (8 million), and Nigeria (5 million), it added.

السبت، 24 مايو 2014

World Region with the Lowest Density of Mobile Phones


via chartsbin.com

This map shows the population without mobile phones in Sub-Saharan Africa. For every mobile phone, an additional .8 percentage point is added to GDP growth. The countries with the largest populations without mobile phones stand to gain the most from growing mobile penetration. 

الجمعة، 23 مايو 2014

Tablet sales to overtake PC +Smartphones by 2015 December


The tablet market has been an example of how technology adoption can be scaled up...by a single market leader..Wha Apple did with iPad... has not  only made the market size bigger but  it reached to an   " unprecedented  heights..


As it  happens  behind every boom there are 1) competitors 2) Accessories market and 3) Cheap Immitators


While most Technology brands started coming up with their versions of " Tablet" Competitors and me too brands followed.. with some creating an exact knock down product,some replicating  the hardware and some the software of Apple's  iPad look and feel":


Four years since Apple introduced the iPad and launched the tablet craze, the U.S. tablet market is maturing. In that short time, tablets have become not only the new entertainment go-to, encroaching on the TV set’s dominance, but they are threatening to supplant the PC as these portable devices become shopping and productivity aids. Here are five charts that put it all into perspective"


Shipments of tablets worldwide is forecast to grow 38.6 percent to more than 349 million units in 2014 as mobile-first adoption catches on, according to Gartner research. By 2015, tablet sales are forecast to overtake those of PCs, whose sales will have declined 6.6 percent in 2014.

After Packaging Tap Water as Vitamin water,Coke launches "Glacéau Smartwater "premium bottled water brand


Coke launches premium bottled water brand by Marketing Week: "Coca-Cola is making a major push into the growing UK bottled water market under its Glacéau brand, a launch that comes ten years after the company hit the headlines with its Dasani water brand, which it was forced to pull from the market after it was revealed the product was just tap water.

Glacéau Smartwater is made from British spring water, which Coca-Cola says is “vapour distilled” before electrolytes are added for taste. It will be produced and bottled in Northumberland, which the company says reflects its “Made in GB” commitment. 

The brand was first launched in the US in 1996 and has grown to become the “leading premium water brand” in the region, according to Coca-Cola,it expects " UK to follow and replicate its success" 

The launch will see a fair amount of online and offline ad and marketing budgets, TV, digital, outdoor and print. This launch is expected to " help" Glaceu brand"name regain some of its " Reputation which had taken a bad hit, during the 2004 Dasani water scandal

 By putting the new smartwater product under the Glacéau name - which is also shared by the popular Vitaminwater products - Coca-Cola will be looking to put the reputation damage suffered by the 2004 Dasani water scandal, when coke suffered a huge damage when it then described as its "highly sophisticated purification process", based on Nasa spacecraft technology, was in fact reverse osmosis used in many modest domestic water purification units. The entire UK supply of Dasani was pulled off the shelves because it has been contaminated with bromate, a cancer-causing chemical