الثلاثاء، 29 نوفمبر 2016

cocaine most abused illlicit drug in europe,united kingdom leads with 4.2% consumption

"cocaine most abused illlicit drug in europe,united kingdom leads with 4.2% consumption"

UK is The Capital Of Cocaine and Gonorrhea in the world 


Which is the most used illicit stimulant in Europe ?According to a Health at a Glance report prepared by Europe OECD "Cocaine is the most commonly used illicit stimulant in Europe," the authors wrote. Across Europe, 1.9 per cent of young adults aged 15 to 34 report using cocaine in the last year with usage rising in the Czech Republic, Finland, France, the Netherlands, Norway and Poland. In the UK this young adult figure stands at 4.2 per cent, far outweighing other European countries.And Britain also lays claim to the unique distinction of having the highest rates of the sexually transmitted disease, gonorrhea. Out of every 100,000 people in the British population, 60 were found to have the sexually transmitted infection.The "Health at a Glance" study finds that the premature deaths of 550,000 working-age people each year results in the potential economic loss of around 115 billion euros - or about 0.8 percent of the EU's annual gross domestic product (GDP) 

In terms of Alcohol among adults, Lithuanian consumption in 2014 was measured to be higher than any other European country, registering more than 14 liters per adult per year. The alcohol "capital of the world in Europe " is Turkey with adults on average downing less than 2 liters per yeaThis compares to a European average of 20 per 100,000 people.For obesity, Malta was the worst offender with 26 percent of the adult population in 2014 considered at an unhealthy weight.


Meanwhile a recent study carried out by the EU's drug monitoring agency found London to have the highest cocaine usage, at 909mg per 1,000 last year - up from 737mg in 2016.When weekend samples only are taken into account, the concentration for London rises to 1044.Amsterdam came second for highest cocaine usage, where the level recorded was 642mg per 1,000.Meanwhile Ecstacy was making a comeback in UK. Figures published last year for England and Wales showed a "statistically significant" rise in the proportion of 16- to 24-year-olds reporting ecstasy use in the last year, up from 3.9% in 2013-14 to 5.4% in 2014-15.

Get the New Microsoft Certifications for 2017

Click to enlarge
Microsoft recently announced significant changes to their technical certifications. In short, Microsoft streamlined certification pathways, launched a range of new Microsoft Certified Solutions Expert (MCSE) and Microsoft Certified Solutions Developer (MCSD) certifications, retired 13 existing certifications and restructured the way you certify and re-earn certifications.

In a recent blog post we outlined these changes, covering what’s new, what’s retiring, how you can achieve these new certifications and the process of re-earning your certs.

Today, we’re excited to announce your fastest route to earning these new MCSE and MCSD certifications, whilst helping you master the latest Microsoft technologies ready for 2017. Read on to discover the accelerated route that’s right for you.

Your fastest route to new Microsoft Certifications


MCSE: Cloud Platform and Infrastructure

MCSE: Cloud Platform and Infrastructure This certification validates the skills necessary to run a highly efficient and modern data centre.

You have two distinctly different accelerated pathways to earn your MCSE Cloud Platform and Infrastructure certification. 


Azure Cloud Platform - On this route you will master Azure across infrastructure and development. You’ll also learn to architect Azure solutions for the modern Enterprise organisation.

This course is 50% faster than traditional training and you will leave both MCSA: Cloud Platform and MCSE: Cloud Platform and Infrastructure certified in just 7 days. 

 Windows Server 2016- this pathway will focus you on learning the skills aligned to the Installation, Storage, Compute, Networking and Identity in Windows Server 2016. You will then focus on developing the skills to Secure Windows Server 2016, critical in a world full of cyber threats. 

This 15 day route is 25% faster than traditional training, during which you will work to achieve both the MCSA: Windows Server 2016 and MCSE: Cloud Platform and Infrastructure. 


MCSE: ProductivityThis credential validates your skills to move your company to the cloud, increase user productivity and flexibility, reduce data loss, and improve data security for your organisation.

You’ll quickly learn the skills to transition your businesses’ communications to the cloud. First you'll master Office 365 and earn the corresponding MCSA , before tailoring your route to the MCSE: Productivity certification, choosing to develop skills aligned to one of the following three technology platforms:

Exchange Server 2016 - on this 11 day route, you’ll learn the skills to design and implement an Exchange Server 2016 messaging environment – 45% faster than traditional training. In working with the technology, you’ll touch on key proficiencies, including how to design and configure advanced components in an Exchange Server 2016 deployment. You'll cover advanced topics covering compliance, archiving, advanced security and discovery solutions. 

SharePoint Server 2016 - this 11 day accelerated route focuses on developing your skills in designing SharePoint infrastructure as well as planning authentication and security, managing search capabilities and monitoring and optimising a SharePoint Server 2016 environment. 

Skype for Business 2015 - here, you have the choice to focus on Deploying Enterprise Voice with Skype for Business 2015 or Core Solutions of Microsoft Skype for Business 2015. Both offer a 9 day route to MCSE Productivity which is 50% faster than traditional training.


MCSE: MobilityEarning this credential demonstrates you have the skills needed to manage devices in today’s bring-your-own-device (BYOD) enterprise. 

First, you'll unlock the skills aligned to the MCSA Windows 10 platform and accelerate your 9 day path to achieving the MCSE: Mobility certification. Choose to develop your skills for Enterprise scale businesses across device management, deployment or administration.

Deploying Windows Desktops and Enterprise Applications - on this route you’ll develop the skills to assess operating system and applicant deployment options, determine the most appropriate deployment strategy and implement a deployment solution for Windows devices and apps that meet your environment's needs.

System Center Configuration Manager and Intune - here you will learn the skills to configure and manage clients and devices by using Microsoft System Center v1511 Configuration Manager, Microsoft Intune and their associated site systems.

 Planning for and Managing Devices in the Enterprise - learn the skills to use Enteprise Mobility Suite to manage Windows 10 devices, users and data. You will expand your knowledge and skills helping you to plan, deploy, and manage devices and applications in medium to large organisations.

Whichever route you choose, you’ll achieve your MCSA Office 365 and MCSE Mobility certification 50% faster with Firebrand, qualifying you for roles including cloud administrator, cloud architect, computer support specialist and information security analyst.


MCSE: Data Management and AnalyticsThe MCSA DMA certification will validate your broad skill sets in SQL administration, building enterprise-scale data solutions, and leveraging business intelligence data—both on-premises and in cloud environments.

Choose your fastest way to master the new SQL Server 2016 platform and tailor your route to MCSE with a choice of developing skills across Business Intelligence, Database Development or Database Administration.

Depending on the MCSE elective you’ve chosen you can further advance your skills in your chosen area in just 8 days. 


MCSD: App BuilderEarning the MCSD App Builder validates that you have the skills needed to build modern mobile and/or web applications and services.

With Firebrand, you'll learn to create and implement web applications that scale using the Azure cloud platform to achieve the MCSA: Web Applications certification and MCSD: App Builder.

Your chosen elective will be Developing Windows Azure and Web Services. You’ll learn how to design and develop services that access local and remote data from various sources. You’ll also get an insight into developing and deploying services to hybrid environments, including on-premises services and Windows Azure. 

This 9 day track is the fastest and most popular route to achieving the MCSD App Builder credential.

Why get Certified with Firebrand Training?


As Microsoft Gold Learning Partners and leaders in accelerated training, we not only offer you the fastest route to your MCSE and MCSD certifications, but we can ensure you’ll have the latest Microsoft Official Curriculum (MOC) and receive excellent training from our experienced Microsoft Certified Trainers (MCT).

Our unique Lecture | Lab | Review technique combines both theoretical and practical exercises to accelerate your learning and develop the hands-on skills required for when you return to work.

You’ll also take all of your exams on-site during the course, which will be covered by your Certification Guarantee.

If you have any other questions about the new streamlined certification paths, you may want to check out this Microsoft blog with the top 12 questions about the new cert changes. Or, if you’re more of a visual learner, the video below discusses the new changes and why they were made with the Director of Microsoft Learning, Shelby Grieve. 


chinese buyout of american business this year exceeds 100 deals valued over $60billion

"chinese buyout of american business this year is over  100 deals  valued over $60billion "

"top 10 biggest chinese buyout of  foreign business"
Biggest Chinese Firms Buying out Foreign Companies


More money flowed out of China last year than in any year before, though it is hard to say exactly how much. Estimates vary from more than $500 billion to $1 trillion. In 2014, just $134.3 billion left China.In 2016, China's outbound foreign direct investment (OFDI) will likely grow even faster than in previous years,according to a report by the National Committee on U.S.-China Relations and a research firm Rhodium Group.A significant share of that capital outflow has already found a home in North America. So far this year, 72 deals (including merger/acquisition and private placement) valued at over $7.5 billion have closed and 27 new deals valued at over $33 billion targeting U.S.-based companies have been announced.That makes it exactly 99 deals that are valued at more than$60billion as of November 2016. 

This compares to 59 deals by Chinese Companies valued at $2.9 billion closing during the same period last year, per data compiled by S&P Capital IQ. The average deal announced so far this year is also much bigger this yeat, a whopping $1.5 billion, an eight-fold increase from last year. Bearish Stock markets in China has not stopped Chinese firms from going on a buying spree for American companies.Direct investments from China put over $15 billion into transactions in the U.S. last year, a near-30 percent increase compared to the previous year and a new all-time high

Moreover, of 27 deals announced this year, five are valued in excess of a billion dollars each and include high-profile transactions such as the acquisition of luxury hotel owner Strategic Hotels & Resorts by Anabang Insurance Group for $8.2 billion, Ingram Micro by Tianjin Tianhai Investment for $7.2 billion (upon completion of the transaction, Ingram Micro will operate as a subsidiary of TianjinTianhai, consolidated under HNA Group) and GE Appliances by Qingdao Haier for $5.4 billion


According to Dealogic data, Outbound M&A spending took a total of $90.6 billion out of China in 2015.Meanwhile the 10 (mostly state-owned) Chinese companies that spent the most money buying foreign businesses last year did $46.6 billion in deals, representing between 5 and 10% of the capital that left China’s borders.

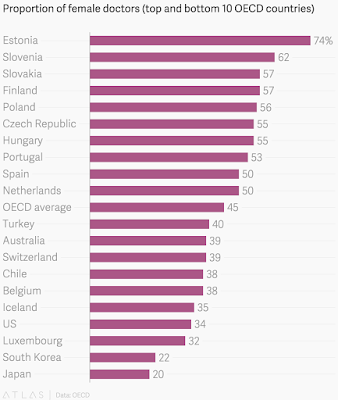
the propotion of female doctors are highest across these 5 east european countries

"the propotion of female doctors are highest across these 5  east european countries"

 
When it comes to probability of  female doctors across the world Estonia top the list of OECD nations. Eastern European nations Estonia, Slovenia and Slovakia top the list of nations with the highest female doctors, followed by Finland,Poland Czech and Hungary.According to latest 2016 data from Quartz almost three in four doctors in the eastern European nation is female that is 75 doctors out of every 100 doctors,far exceeding the UK’s 46% and the US’s 34%. European countries as a whole dominate the majority of workforce for the proportion of women in healthcare.The OECD report suggests that men and women’s work schedules are converging, however. And aside from rethinking their approach to a standard doctor’s working routine, most OECD countries have a bigger problem ahead: The average age of doctors in almost all of the countries surveyed is increasing.On average, 33% of physicians in the countries monitored were over 55 years old in 2013, up from around 20% in 2000. In some countries, such as Italy and Israel, almost half of all doctors were over 55, the study found.


However while women in eastern nations have consistently produced higher doctors than compared to other professions like Lawyers, a recent research conducted by TheAtlantic magazine show that women are much more likely to drop out of these professions (and others). Among early-career professionals—people ages 25 to 44—who list their most recent jobs as doctor or lawyer, doctors who are woman are much more likely to be out of the labor force early.


the frothiness of american housing market explained in 2 interactive charts

"the frothiness of american housing market  explained in 2 interactive  charts"

UNITED STATES HOUSE PRICE INDEX


"state of the unites states housing charts in 3 charts"

UNITED STATES HOUSING PRICES IN REAL TERMS


The latest data from economist explains, the state of frothiness and uncertainty of US Housing market. Despite efforts to fix the American housing mortgage market, housing in the United States still remains a dangerous in terms of disrupting the world economy.As property prices in the united states  underpinned by low interest rates, forge ahead,however on average, American home prices have recovered nearly all their losses from the 2006 crash, but when adjusted for inflation they are still 20% below the 2006 peak. explains the chart.

.Also the construction of new homes remains lukewarm.The rate at which homebuilders are constructing new single family homes remains quite depressed, despite steadily increasing demand. Those in the business have argued that demand and supply-side factors, like increased regulation & ashort supply of skilled labor as reasons they have been slow to meet demand.The Homes Being Built are Mostly for the High End of the US Housing Market.

Another roadblock for prospective home owners is that "lack of credit".This also means that The lack of credit available for new homebuyers has forced more and more homeowners into the rental market, driving up rents and put further pressure on already strained middle-class budgets.The mean modal age in America is 26, and this echo-boom generation has yet to settle down and seriously consider home buying and home ownership. Analysts hope that this new demographic wave will provide a jolt and a shot in the arm to the  the housing sector back into pre-bubble normalcy


To gauge the frothiness of America’s housing market, The Economist looks at two measures of affordability:1) The ratio of price to income and 2) price to rent. Encouragingly, across America prices appear to be at fair value when compared to their long-run averages. Yet in some cities, such as San Francisco, affordability looks stretched when compared against income—prices in the City by the Bay are 40% above their long-run average when compared to income. Theory suggests that they should eventually fall back down to earth.

الاثنين، 28 نوفمبر 2016

black friday sales breaks $3billion barrier, ends at $3.34billion,mobile rakes in $1.2billion alone

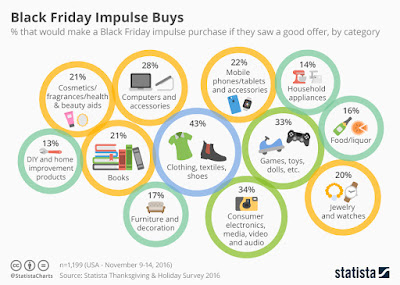
"thanksgiving and black friday 2016 sales hits a record high this year"

Black Friday Shopping : top 10 Impulse Buys:


Black Friday online sales in 2016 delivered a record breaking number as it broke the $3 billion barrier, and closed the day to $3.34 billion, which was a increase of 21.6 percent growth on a year-over-year basis. Mobile sales took up one-third of that number, with a total of $1.2 billion in sales on Black Friday alone.One of the most important highlights this year on  black Friday was the role of mobile devices.“Smartphone conversions were at 1.9 percent, compared with tablets at 3.7 percent, and desktops at 4 percent. In general , holiday averages are 1.3 percent, 2.9 percent, and 3.2 percent, for phones, tablets, and desktops, respectively.Although initial reports from Adobe,expected Black Friday 2016 sales to touch about $3.05 billion in sales by the end of the day, or 11.4 percent more sales compared to the previous year’s retail holiday. However the number was much above what " it had predicted " Mobile sales totalled $3.46 billion between Thanksgiving and Sunday,which included Black Friday and Thanksgiving day a 28% increase year over year.

In the United Kingdom, British retailers John Lewis and Currys PC World both reported “a surge in orders” on Black Friday, while sales figures for several other retailers also hit record levels in terms of online sales. Barclaycard, which is responsible for close to 50 percent of all U.K. credit and debit card transactions, likewise announced that payment transactions enjoyed a six percent uptick on Friday on a year-over-year basis.


Meanwhile both retail sales and online sales saw big gains as Shoppers put in a strong showing on Thanksgiving Day and Black Friday. Holiday spending rose 9% Thursday and Friday combined, compared with the same two-day period last year, according to First Data. As E-commerce sales rose 10.8%  for the 2 day period, while sales at physical stores grew 8.6% as per reports from first data, which analyzed online and in-store payments across different forms of payment cards from nearly one million merchants on Thanksgiving and Friday. The data captures about 40 percent of all card transactions in the U.S. but excludes cash.

الجمعة، 25 نوفمبر 2016

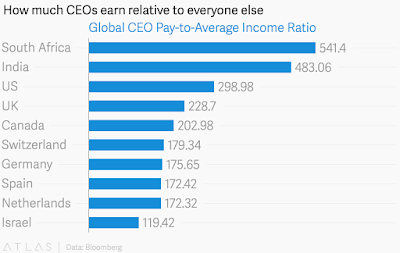
ceo's in which country are they paid the highest salaries:

"CEO's pay and how it places across the world"


Which places across the world does a CEO earns the highest amount vis a vis other CEO's. For example does a CEO at US earn the same across similar industry in South Africa or UK. Well not so.. The United States may have the highest paid CEOs, but South Africa is where CEOs get paid highest in the world  and they  live  a life far above the rest CEO's across other regions.The above chart shows which nations are the Chief Executive Offers get paid the highest irrespective of the industry.It also considers how much are they paid compared to everyone else 

South African CEOs are among some of the best paid in the world, and earn more than 500 times more than the average South African.The figures are the latest statistic illustrating how South Africa is consistently one of the most unequal societies in the world. South Africa ranked seventh when counting CEO salaries around the world, according to a Bloomberg survey of executive paychecks around in the world’s 25 largest economies. But Africa’s most advanced economy rocketed to the top when considering how executive packages compared to the average income in the country. The average income in South Africa is $13,194, measured in GDP per capita adjusted to purchasing power in 2015 and 2016. The average CEO earned $7.14 million, 541 times more than the average income

After South Africa,CEO's in India gets paid the highest, almost one and  a  half times  , than what a CEO of similar company across the same industry earns in United States . CEO's in UK gets paid less than what they would be receiving in United States. While CEO's in Canada ,Switzerland,Germany and Spain follow where the gap between  what they earn and everyone else is probably lower


2016 hottest thanksgiving and black friday holiday purchases

"2016  hottest thanksgiving and black friday holiday purchases"

Ranking from 1 to 5, these are the 2016 Hottest Holiday Gifts, for Thanksgiving,Black Friday and New Year. 1)Apparel and Clothes 2)Consumer Electronics 3)Video Gaming 4)Toys 5) Gift cards.This year during Thanksgiving about 137.4 million Americans are expected to head out and participate in the Thanksgiving shopping frenzy.Traditionally, Black Friday and Cyber Monday are two of the biggest U.S. shopping days, with customers splurging billions in cash to kick off the holiday shopping season. According to research from Nielsen, 61 percent of U.S. consumers are planning to purchase some form of apparel item this year. Consumer electronics and video games are also hot properties this year, with 56 and 43 percent of customers respectively planning to purchase them.


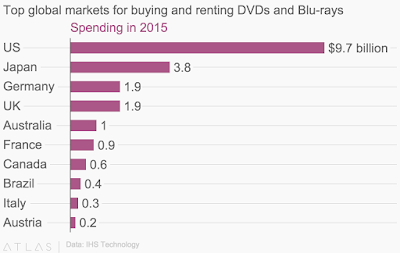
us, japan and germany top as the biggest market for dvd and blu-rays


"music streaming and biggest dvd markets"

"us, japan and germany top as the biggest market for dvd and blur-rays"


Since 2011, consumer spending on home entertainment in the U.S. averaged around 18 billion U.S. dollars per year. However The preliminary numbers are in for consumer spending in the U.S. home entertainment business for 2015, and all is not what it may seem. What the DEG: Digital Entertainment Group refers to as “total U.S. home entertainment spending” is up almost 1% to just over $18 billion last year, reversing a 1.8% decline registered in 2014.

According to research published by the  (DEG), full-year revenue from the sale of DVDs and Blu-ray Discs declined nearly 11 percent in 2014, to $6.93 billion, while digital spending, which includes subscription streams as well as video-on-demand services, shot up more than 16 percent, to $7.53 billion.Meanwhile the fact that DVD subscribers  have been dwindling in US every day is best explained  by the fact that DVD sales declined  by 15% over the last year, standing at 2.7 million today.

Online Streaming services have sounded the  death knell of  the DVD industry .In 2015, online subscriptions were estimated to account for almost 50 percent of all movie and TV rentals in the U.S. Together, stores and kiosks held an estimate of 24 percent of the market, showing rental services are losing market share for online services.  Netflix meanwhile after seeing consistent growth for the last 8 to 12 quarters is showing signs of  stagnating growth as International subscriber growth slowed sharply in the second quarter from the first as the company launched in 130 new markets in January

الخميس، 24 نوفمبر 2016

the growth of the cannabis start up companies by sector

" growth of the cannabis and pot industry start ups by sector"

 
On the day Donald Trump won the election, leaving behind a startled Hillary Clinton and dividing America .That election day increased the number of Americans who can get legally high to one in five, the business of weed is booming. There are now 727 companies companies dealing in cannabis, and combined, they’ve gotten $1.2 billion in total investment, reports analytics and data visualization firm Quid. As marijuana leaves the black market behind, the business of working with the stuff is starting to look a lot like other industrial sectors: The Marijuana and Cannabis start up economy is on steroids and as of  nov,2016 United States has a total of 727 companies across all locations received $1.2 B in total investment.


top 10 cities which is home to highest mobile shoppers

"these 10 american cities has the highest number of mobile shoppers"

Houston,Seattle,San Francisco and Los Angeles are the top 5 american cities which has the highest number of mobile shoppers


For the second straight year Houston has claimed the No. 1 spot on the Interactive Advertising Bureau's U.S. Mobile Shopping Savvy Cities Index, which the IAB says is due to the city's mobile shopping versatility and dexterity. The rankings are determined by mobile usage patterns and the frequency of use among mobile shoppers in major U.S. cities. For the purposes of the index "mobile shopping" is defined as making purchases using a phone or tablet, and also using mobile devices to research products that are later bought at brick-and-mortar locations. Houston is followed on the list by three West Coast cities–Seattle-Tacoma, San Francisco and Los Angeles–with the highest-ranking East Coast market, New York, rounding out the top five.


retail website online sales : mobile vs desktop comparison


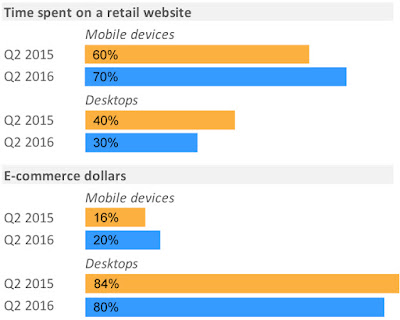
Consumers  are spending more time on Mobile devices, specially when they are surfing online retail sites. Around 70% consumers are going online across mobile during Q2,2-16  as compared to 60%  during Q2,2015..Whereas Desktop usage  for surfing online retail sites has gone down by 10%( 40% in 2015 as compared to 30% in 2016).In terms of eCommerce,mobile devices now account for 20% of  sales  ,up from 16% in 2015.

mobile devices and ecommerce :mobile vs desktop

Mobile devices account for a growing portion of time spent on retail website and sales in Q2 2016 compared with Q2 2015.( Mobile devices here mean smartphones as well as tablets

الأربعاء، 23 نوفمبر 2016

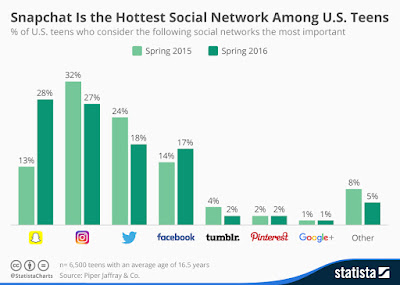
snapchat's numbers and metrics in 3 charts: how it became the hottest teen destination

"social media usage in teens in US and snapchat"
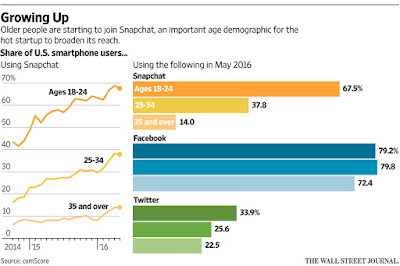
" the demographics and metrics of snapchat"

How Snapchat evolved itself to become the hottest Teen Destination social media website 


As Snapchat , another  giant internet brand starts to prepare for its IPO, here are some numbers which show how Snapchat user base has grown over time . Snapchat presently has around 150 million daily active users globally,. Snapchat as of October,2016 has 60 million daily active users in the U.S. and Canada,  which makes up around a third of Facebook’s 175 million daily users in the same region.This region is the most lucrative advertising market, with  a very high average revenue per user for social networks. For Facebook  its  per user revenue across US and Canada is $12.43, which is 4 times its global revenue of  $3.34. Snapchat most recently closed a $1.8 billion funding round in May,2016  when investors valued the company at about $18 billion. and has been growing at a 30% annual growth rate.

In Alexa Snapchat ranks 2000 in US, and ranks 3973 worldwide.With a bounce rate of 40%,its daily page views per user is 2.7 who spends approx 2.56 minutes on the website.Around 30% of its users comes from Google, followed by 4% from Facebook,3.5% from YouTube and 3% of Instagram. In terms of demographic, Snapchat has a more progressive male tilt, with 55% user base,while female user base hovers between 30 to 35% The company is forecast to reach nearly $1 billion in global advertising sales in 2017, up from an estimated $366.7 million in revenue this year, according to a recent report by forecasting firm eMarketer. 

So how does Snapchat compare to Instagram , another photo social networking site ?..By comparison, Facebook-owned Instagram, with 500 million monthly users, will generate $1.5 billion in global ad sales this year and $2.8 billion in 2017.Snap Inc. launched its ad business in mid-2015. The company sells full-screen, vertical video ads in its “Discover” and “Stories” sections, which play with sound after users click them. 


Snapchat’s Discover section, which features articles and video from more than a dozen publishers such as CNN, iHeart Radio and Cosmopolitan, generates nearly half of the company’s total U.S. ad revenue, according to eMarketer. Snap Inc. also sells geofilters and lenses. Recently Snapchat unveiled its first hardware, $129.99 video-capturing sunglasses, and renamed itself as “Snap Inc.” to reflect its new direction

الثلاثاء، 22 نوفمبر 2016

globally internet of things to exceed $11trillion by 2025

"internet of things prediction and stats"

Internet of things is set to touch $11trillion by 20125


Globally IOT ( Internet of things) is just getting started. However Internet of things is set to touch upto $11trillion and more  by 2025  compared to just$4 trillion in 2015. That is a jump of almost 3 times in mere10 years. So what exactly is Internet of Things ( IOT) ? Basically it means , people, internet and things will get connected seamlessly.This includes everything from cell phones, coffee makers, washing machines, headphones, lamps, wearable devices and almost anything else you can think of. 

This also applies to components of machines, for example a jet engine of an airplane or the drill of an oil rig The analyst firm Gartner says that by 2020 there will be over 26 billion connected devices.That’s a lot of connections (some even estimate this number to be much higher, over 100 billion).The IoT is a giant network of connected “things, People" which will be connected by internet. The relationship will be between people-people, people-things, and things-things.If policy makers and businesses get it right, linking the physical and digital worlds could generate up to $11.1 trillion a year in economic value by 2025.


debit card usage in india post demonetization of rs 500 and rs 1000

"debit card usage in india post demonetization of rs 500 and rs 1000"
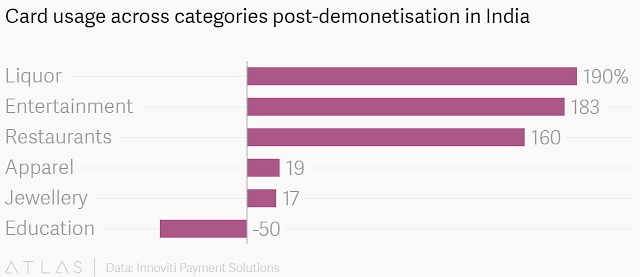
Sectors that have seen  highest adoption of debit cards in India after demonetization

  Liquor buying, spending on entertainment and restaurants and shopping.These 3 industries has seen the highest adoption of online shopping in India after the government demonitised Rs 500 and 1000 notes in India .Buying Liquor online has showed a 190% increase via debit cards, while spending on entertainment has gone by 183%.
Education sector, paying  fees, and private tutions has been the worst hit, and has seen a dip of 50% when it came to spending by debit cards. One likely explanation is that " Education " spending  including private tutions and fees are largely accounted by " Rural and Semi urban townships"  . Thus percentage has probably gone down, as urban users continued to pay online, however the adoption of  rural folks paying online for Schools and colleges has not picked up
Another explanation is probably that  Indians have clearly  given their choice on what they really want .Between Liquor  entertainment and studying , It has clearly made their choices loud and clear .  


why fake news can never be solved by google and its search spiders

" why google search spiders wont be able to solve fake news"
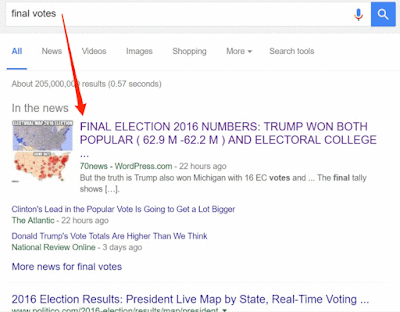
Example of fake news, when a little known website  was ranking in first results for the term final votes which had fake information showing Trumps winning both popular and electoral college votes

 
Fake news might continue to play  havoc with our " online ecosystem" and there is little search engines can do to weed out fake stories and information that are untrue.The fundamental problem seems to be that no matter how smart or potent Google or its search algorithm can  turn out to be, it cannot vet a story or a news report is authentic or incorrect. Google search spiders  can still be very dumb on complex and nuanced topics. It can also be misled by those who accidentally or deliberately post material that seems to be factual in nature but is not. 

While Google  treats unique content as a major factor in ensuring ranking, it has no way to determine if that content is true or based on facts" Human Vetting and not "google algorithms"remains the only possible solution to tackle this growing menace of fake news.Post US elections,while  debate rages across the world  on the  role played by fake news,this is just the start and perhaps a wake up call to  "Search and Social Media Websites" to start taking action. 

Governments across the world, along with army of  social media bloggers can start causing a lot of upheaval and chaos if unfiltered news continues to "grow unchecked" Google continues to show fake news in many queries. For example Google especially came under fire after it listed a site with incorrect “final” US presidential election counts as the top listing for searches such as “final votes” or “final election count.” Here’s an example of that, spotted by Kara Eccelston, on November 13: "The snapshot of the page is shown below 
"fake news causing alarm across the world"


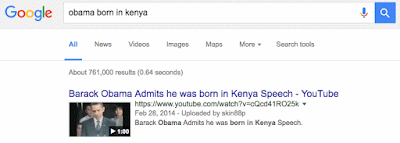
The problem Google has a real challenge in automatically assessing whether something is actually true or not. mean, even US President-Elect Donald Trump has admitted that US President Barack Obama was born in the United States, yet the first listing in Google for a search on “Obama born in kenya” is a YouTube-hosted video saying Obama “admits” he was born in Kenya: