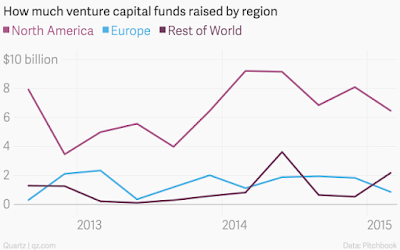
The chart shows the total VC investment by region specifically compares US , Europe and Asia. The data compiled from EY and Qz shows how VC funding from the years 2007 onwards to 2015. The first chart clearly shows US dominating the world of global Venture Funding from 2013 onwards. Meanwhile the second chart shows the VC funding global contributers: 2007 to 2013 which inlcudes Asian nations of India and China besides, Israel.The last 2 years has seen European VC funding dry up while the numbers from other nations including asia increase. Israel, China and India has been also shown growing up in stature
الاثنين، 15 يونيو 2015
Venture Funding Raised by region :US vs Europe vs Asia
The chart shows the total VC investment by region specifically compares US , Europe and Asia. The data compiled from EY and Qz shows how VC funding from the years 2007 onwards to 2015. The first chart clearly shows US dominating the world of global Venture Funding from 2013 onwards. Meanwhile the second chart shows the VC funding global contributers: 2007 to 2013 which inlcudes Asian nations of India and China besides, Israel.The last 2 years has seen European VC funding dry up while the numbers from other nations including asia increase. Israel, China and India has been also shown growing up in stature
الاشتراك في:
تعليقات الرسالة (Atom)


ليست هناك تعليقات:
إرسال تعليق