‏إظهار الرسائل ذات التسميات Country comparison. إظهار كافة الرسائل

الأحد، 13 ديسمبر 2015

country comparison : eCommerce revenues compared as a percentage of overall retail sales

The below chart shows " worldwide and global online retail sales revenues  as a percentage of total retail sales across geographies and countries . Globally online retail sales  across the world is expected to grow by 15% CAGR ( from 2014-2019 ) time period. In terms of  total retail revenues, Worldwide  online retail will constitute 9% of overall retail revenues  in 2019 as compared to 5.8% in 2014  

country  comparison : eCommerce revenues compared as a percentage of overall retail sales
HOW MUCH DOES ONLINE RETAILS SALES CONTRIBUTE AS A PERCENTAGE OF TOTAL RETAIL SALES BY COUNTRY AND REGION

  • Online retail sales in US  is likely to constitute 12% of the overall retail sales by 2019.
  • Online retail sales in North America  is predicted  to account  for 11% of overall retail sales.
  • Asian online retail sales will constitute 10% of total retail revenues ,by 2019
  • In Western Europe online retail sales is expected to contribute 10%of total retail sales, while Eastern Europe it will be 5.6%
  • Russia  online retail is foretasted to form 5.2%of overall retail sales
  • While eCommerce in Latin American nations is predicted to account  for a mere 3,2% of total retail sales 
  • In Australasia online retail is expected to contribute 8.4% of overal retail sales revenues by 2019
  • Mid east and African nations eCommerce sales as a percentage of total retail sales will account or the lowest ever with 1.6% 


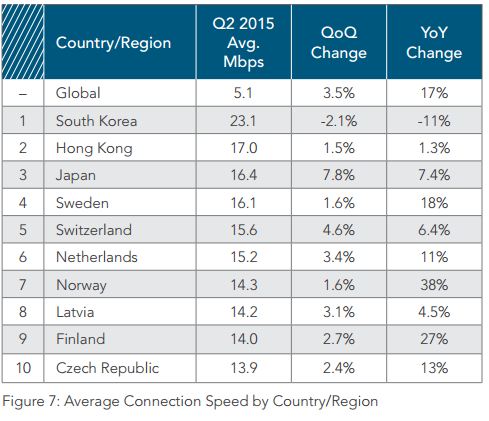
internet speeds across the world: 50 nations compared

The global average connection speed saw a 3.5% increase in the second quarter of 2015, to 5.1 Mbps. According to Akamai state of the internet 2015 report.The below chart compared 50 nations and their internet connection speeds.Globally web speeds increased across the board for the top 10 countries/regions, with the exception of South Korea, which saw a 2.1% decrease from the first quarter. Japan saw the largest quarterly gain at 7.8%, while the remaining eight countries saw modest gains ranging from 1.5% in Hong Kong to 4.6% in Switzerland.


On a global basis, 107 of the 143 qualifying countries/regions saw average peak connection speeds increase from the first quarter, with growth ranging from 0.1% in Trinidad and Tobago (to 34.9 Mbps) to 100% in Egypt (to 23.4 Mbps). Other than Egypt, four countries—Uzbekistan, Mauritius, Ghana, and Tunisia—saw quarterly increases of over 50%.


الأربعاء، 17 يونيو 2015

UK digital spends to reach £8.1b, to make up 50% of total ad spending


The UK will this year become the first country in the world where half of all advertising spend goes on digital media. Just over £16.2bn will be spent on all forms of advertising in the UK this year, including TV, newspapers, billboards, radio, online and on mobiles and tablets, according to eMarketer. Digital advertising is expected to grow by 12% this year to £8.1bn, making the UK the first country in which £1 in every £2 will go on digital media.

الجمعة، 5 يونيو 2015

company holding pattern across the world's top internet companies


"company holding  patterns across top internet companies"


Company Holding types; How many  Internet companies  in the world start up report are Public, Private and  how many have been acquired ?
As the world start up report suggests  that the most bigger and valuable companies  that  make to the top 10 lists are publicly held.This is all the more important why  all successful  start ups should take the public route  eventually
Public companies would on average be 6x bigger than Private companies and over 60 times larger than the average acquisition value (the above  stats show)
8 companies of ‘TOP 10 companies’ list are Public.Post Alibaba's successful   IPO , just one  of company in the TOP 10 is private.

الجمعة، 29 مايو 2015

how secure is your job :global job security index


" levels of global employment vs unemployment"
The  above data shows global  employment  index and Job security data . While high income developing nations have  ( predominant permanent jobs (77% )  followed by temporary and almost minimal  unemployment   compared to Low income countries  where the permanent jobs are much lesser and mainly  led by  temporary  jobs (81%) while middle income countries  have  a reasonable split in permanent and temporary jobs along with  low unemployment.
According to ( ILO data ) only quarter of global workers ( 25% )are on permanent contracts while the rest are unpaid at home, self-employed, working informally or employed on a temporary contract.